control_plotly.pzmap
- control_plotly.pzmap(sys_list, x_lim=None, y_lim=None, x_title=None, y_title=None)
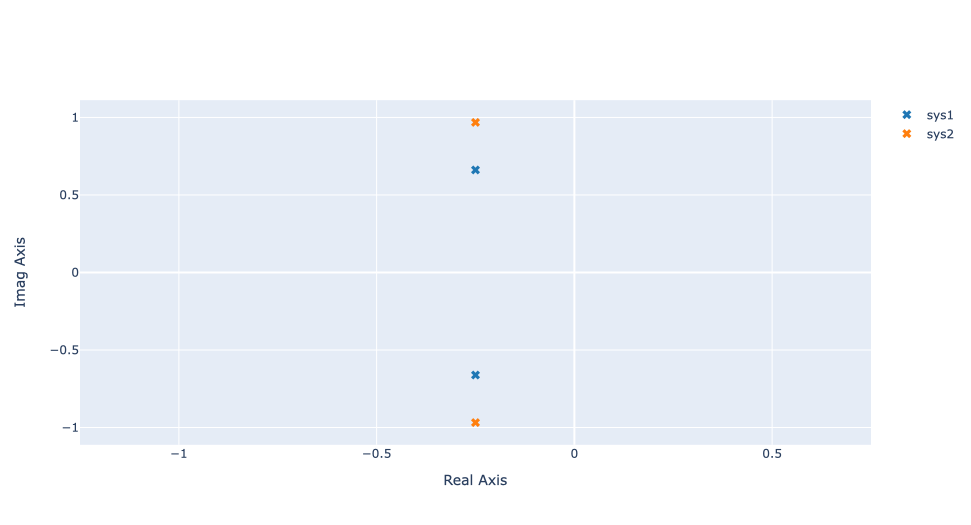
Returns a pole-zero plot of the continuous or discrete-time systems sys_list.
- Parameters
sys_list (system or list of systems) – A single system or a list of systems to analyse
x_lim (list (optional)) – A list of two element that defines the min and max value for the x axis
y_lim (list (optional)) – A list of two element that defines the min and max value for the y axis
x_title (str (optional)) – The x axis name
y_title (str (optional)) – The y axis name
- Returns
fig – A plotly figure
- Return type
plotly figure
Example
import control as ctl
from control_plotly import pzmap

sys1 = ctl.tf([1],[2,1,1])
sys2 = ctl.tf([1],[1,0.5,1])
pzmap([sys1,sys2])