control_plotly.bode
- control_plotly.bode(sys_list, w=None, x_lim=None, y_lim=None, dB=True, Hz=False, deg=True, log_x=True)
Returns the impulse response of the continuous or discrete-time systems sys_list.
- Parameters
sys_list (system or list of systems) – A single system or a list of systems to analyse
w (numpy vector (optional)) – The base angular frequency vector (in rad/s)
x_lim (list (optional)) – A list of two element that defines the min and max value for the x axis
y_lim (list (optional)) – A list of two element that defines the min and max value for the y axis
dB (boolean (optional)) – Use a logarithmic scale for the magnitude plot
Hz (boolean (optional)) – Use frequency in Hz for the x axis
deg (boolean (optional)) – Use angle in degree for the phase plot.
- Returns
fig – A plotly figure
- Return type
plotly figure
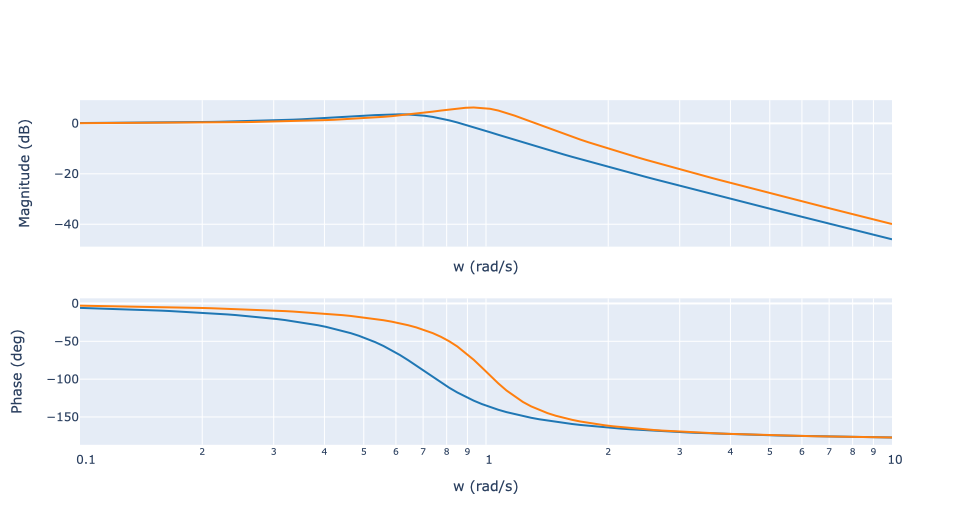
Example
import control as ctl
from control_plotly import bode

sys1 = ctl.tf([1],[2,1,1])
sys2 = ctl.tf([1],[1,0.5,1])
w = np.logspace(-1,1,100)

bode([sys1,sys2],w=w)